Data domains
Finance, operations, investment
Unified into one executive-facing reporting experience.

Outcome-first metrics
Data domains
Finance, operations, investment
Unified into one executive-facing reporting experience.
Delivery assets
Dashboard + user guide + technical spec
The proof of concept shipped with both working screens and handover documentation.
Outcome signal
Stakeholder-validated POC
Validation workshops helped refine metrics, layout, and next-step feasibility.
Summary
The project produced a stakeholder-validated proof of concept that combined a unified KPI dashboard, AI-assisted anomaly visibility, and user and technical documentation for further evaluation.
Problem
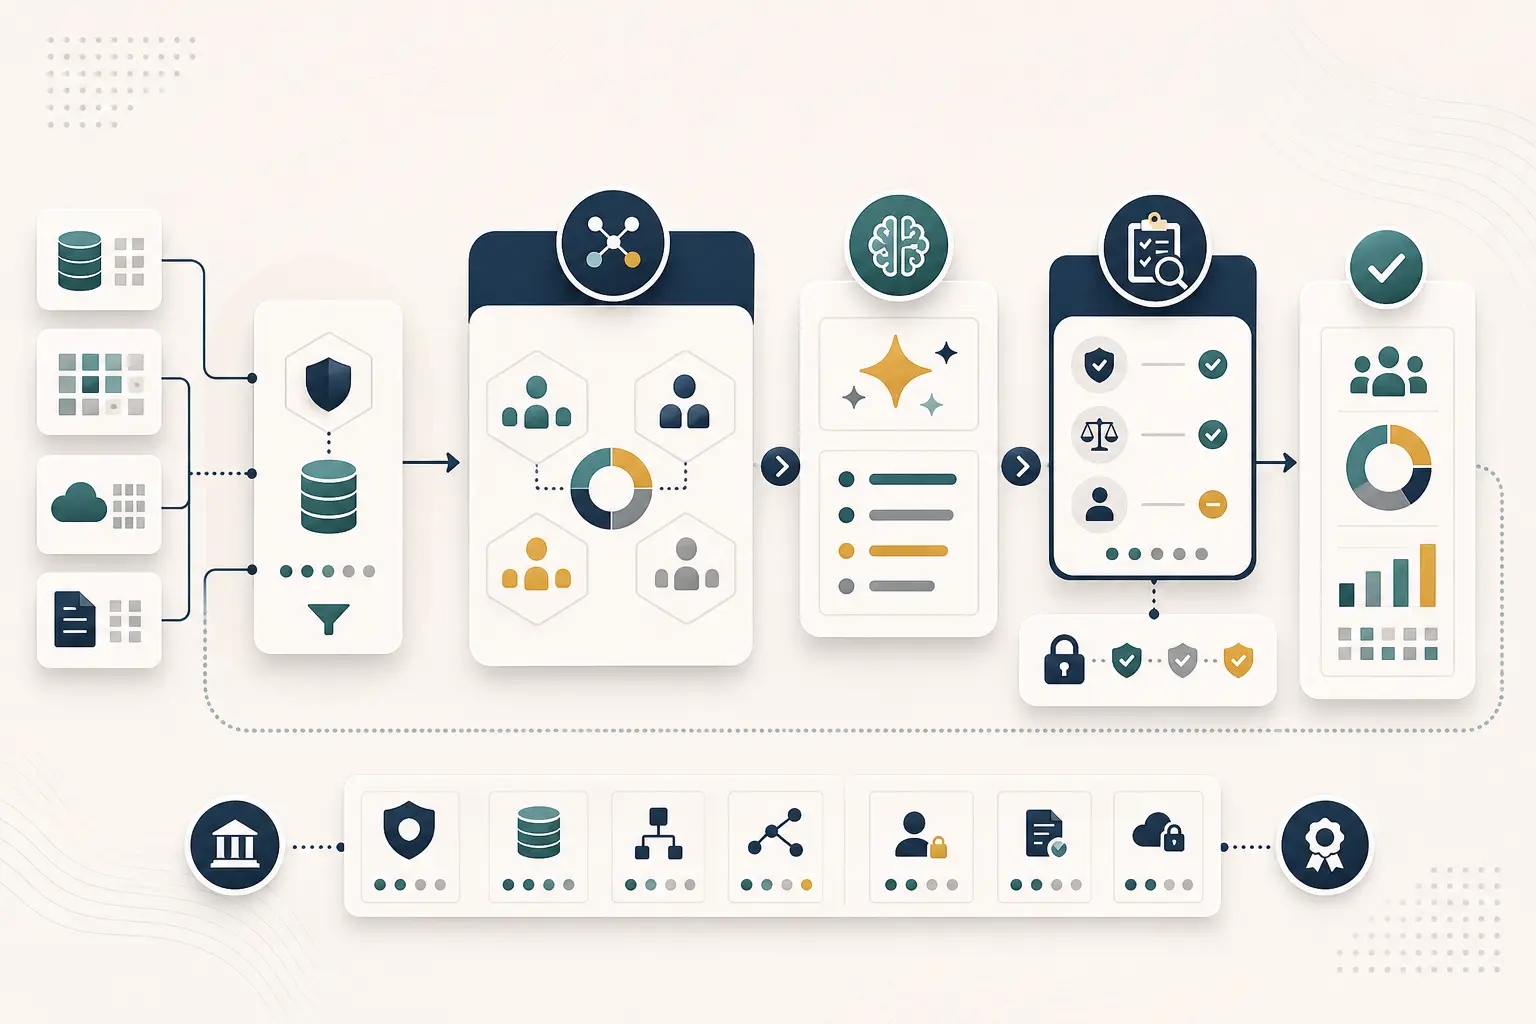
Leadership teams needed a single view of financial and operational KPIs, along with anomaly and insight visibility in one place.
Context / Constraints
The work sat inside a broader digital-transformation initiative and had to make AI-assisted monitoring understandable for non-technical executives.
Approach
Co-developed a Power BI control tower proof of concept that unified KPI monitoring with an AI-assisted watchtower layer, while also supporting dashboard layout decisions, validation workshops, and documentation for handover.
Outcome
The project produced a stakeholder-validated proof of concept that combined a unified KPI dashboard, AI-assisted anomaly visibility, and user and technical documentation for further evaluation.
My Role
Visualization development, stakeholder validation, and POC documentation
Trade-offs / Lessons
Additional Notes
Contact
Start with the current constraint, what needs to change, and where delivery risk is showing up now.
Related Work
Case studies connected by shared themes, delivery patterns, or adjacent technical focus.
AI-Assisted BI
Debt collection messaging was largely template-driven, which limited how well it could adapt to borrower context across segments. Any AI-assisted approach had to work inside banking governance constraints — limited data movement, strict auditability, and no assumption that model output reaches a customer without human review.
What this proves
Framed as a feasibility POC, not a scaled production transformation. The value of the engagement was a clear, review-ready view of what AI in this context can and cannot responsibly do today.
Semantic Model Engineering
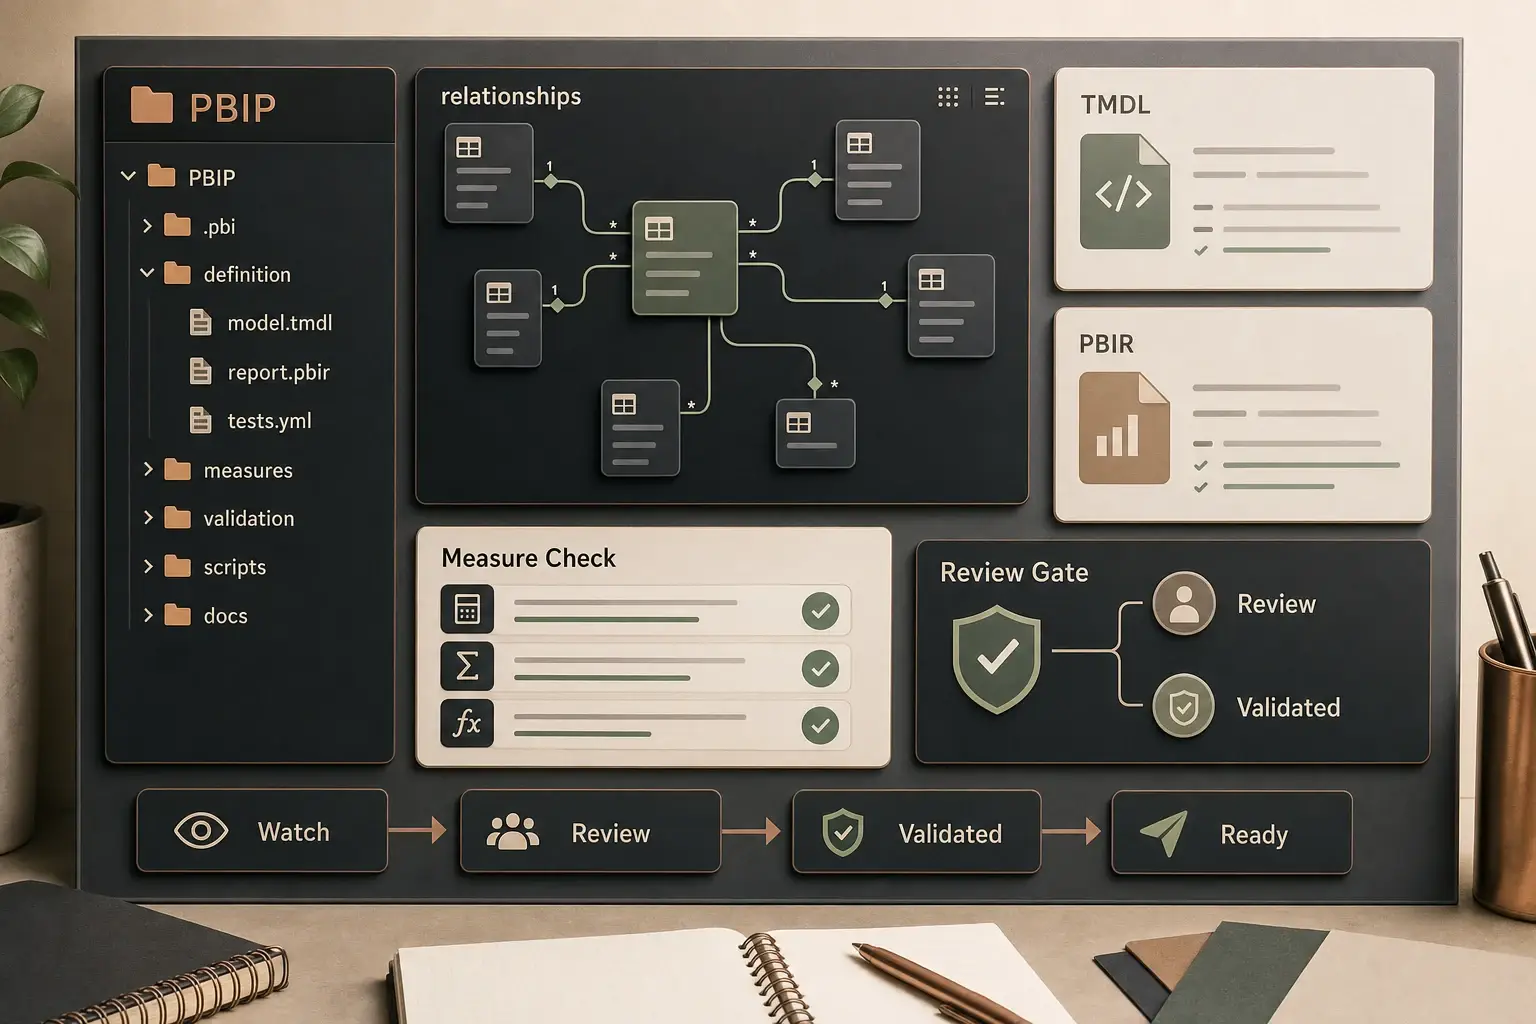
Maintaining 10+ production Power BI datasets and reports alone made measure-level regressions easy to miss. Changes were reviewed manually, if at all, and confidence in deployment dropped as the models grew. The underlying issue: a `.pbix` opened and saved is a review black box — nothing compares the model before and after.
What this proves
Shows a recent workflow built from real production-maintenance needs — PBIP + TMDL + PBIR as the foundation for treating Power BI like production code — with public proof through a GitHub repo and a Mar 2026 speaking session.