Performance Tuning
Retail Dashboard Performance Tuning
A retail analytics dashboard used by five departments loaded in over 90 seconds, making it impractical for daily decision-making.
Case study · Performance Tuning
One analytics path went from about 25 million rows to under 100,000 through the pre-aggregation redesign. In later test rounds under 30-user concurrency, identified issues dropped from 43 to 2 after a combined model and infrastructure tuning pass.
One analytics path went from about 25 million rows to under 100,000 through the pre-aggregation redesign. In later test rounds under 30-user concurrency, identified issues dropped from 43 to 2 after a combined model and infrastructure tuning pass.
A retail analytics platform needed a more maintainable reporting-layer design and better performance under concurrent usage as analytics adoption expanded.
The modernization effort had to improve performance without breaking downstream reporting for a broader analytics rollout.
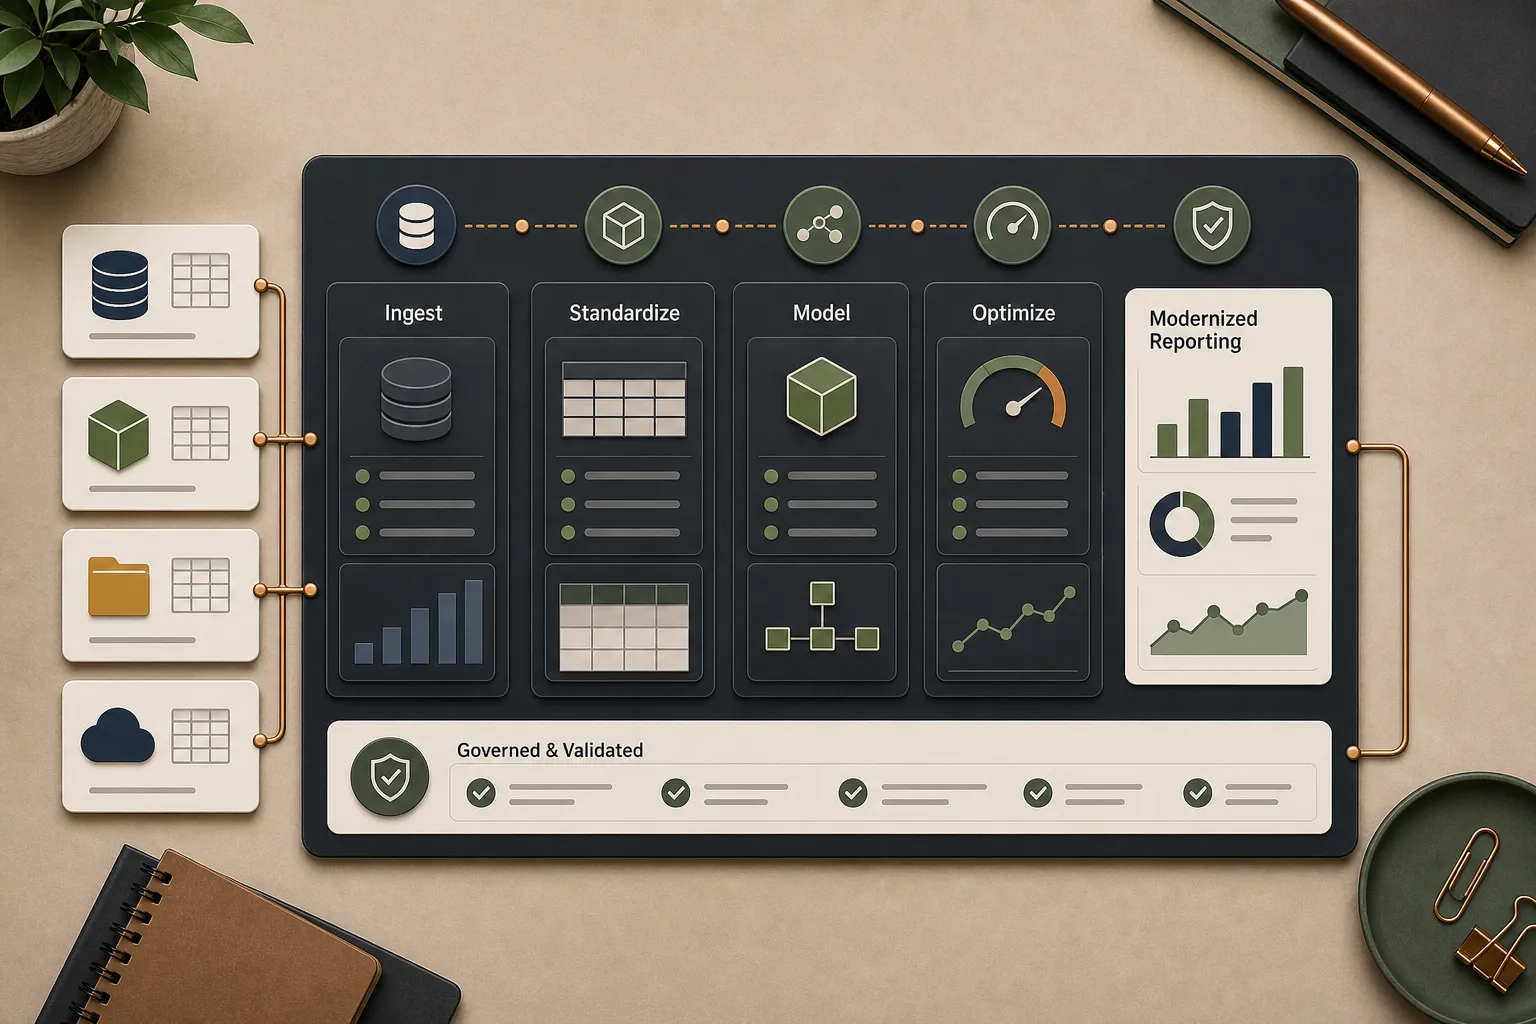
Redesigned the consumption layer into subject-specific models and pre-aggregated tables, ran TabJolt-based concurrency testing across the analytics stack, and coordinated with the platform team on the infrastructure tuning needed alongside the model changes.
One analytics path went from about 25 million rows to under 100,000 through the pre-aggregation redesign. In later test rounds under 30-user concurrency, identified issues dropped from 43 to 2 after a combined model and infrastructure tuning pass.
Shows architecture-level performance work with rollout-readiness evidence, not dashboard polish.
Reporting-layer redesign, performance testing, and rollout coordination
Tools: AWS Redshift, Tableau, TabJolt, Databricks
Start with the current constraint, what needs to change, and where delivery risk is showing up now.