Dashboard Design
Customer 360 Lead-Generation Dashboard
Business teams needed a more unified view of customer, product, and insurance data for cross-sell and lead-generation analysis.
Case study · Governance Visibility
The interim scorecard was delivered on schedule, approved by stakeholders, refreshed automatically each month, and handed over with documentation so the client team could maintain it until the longer-term governance platform was in place.
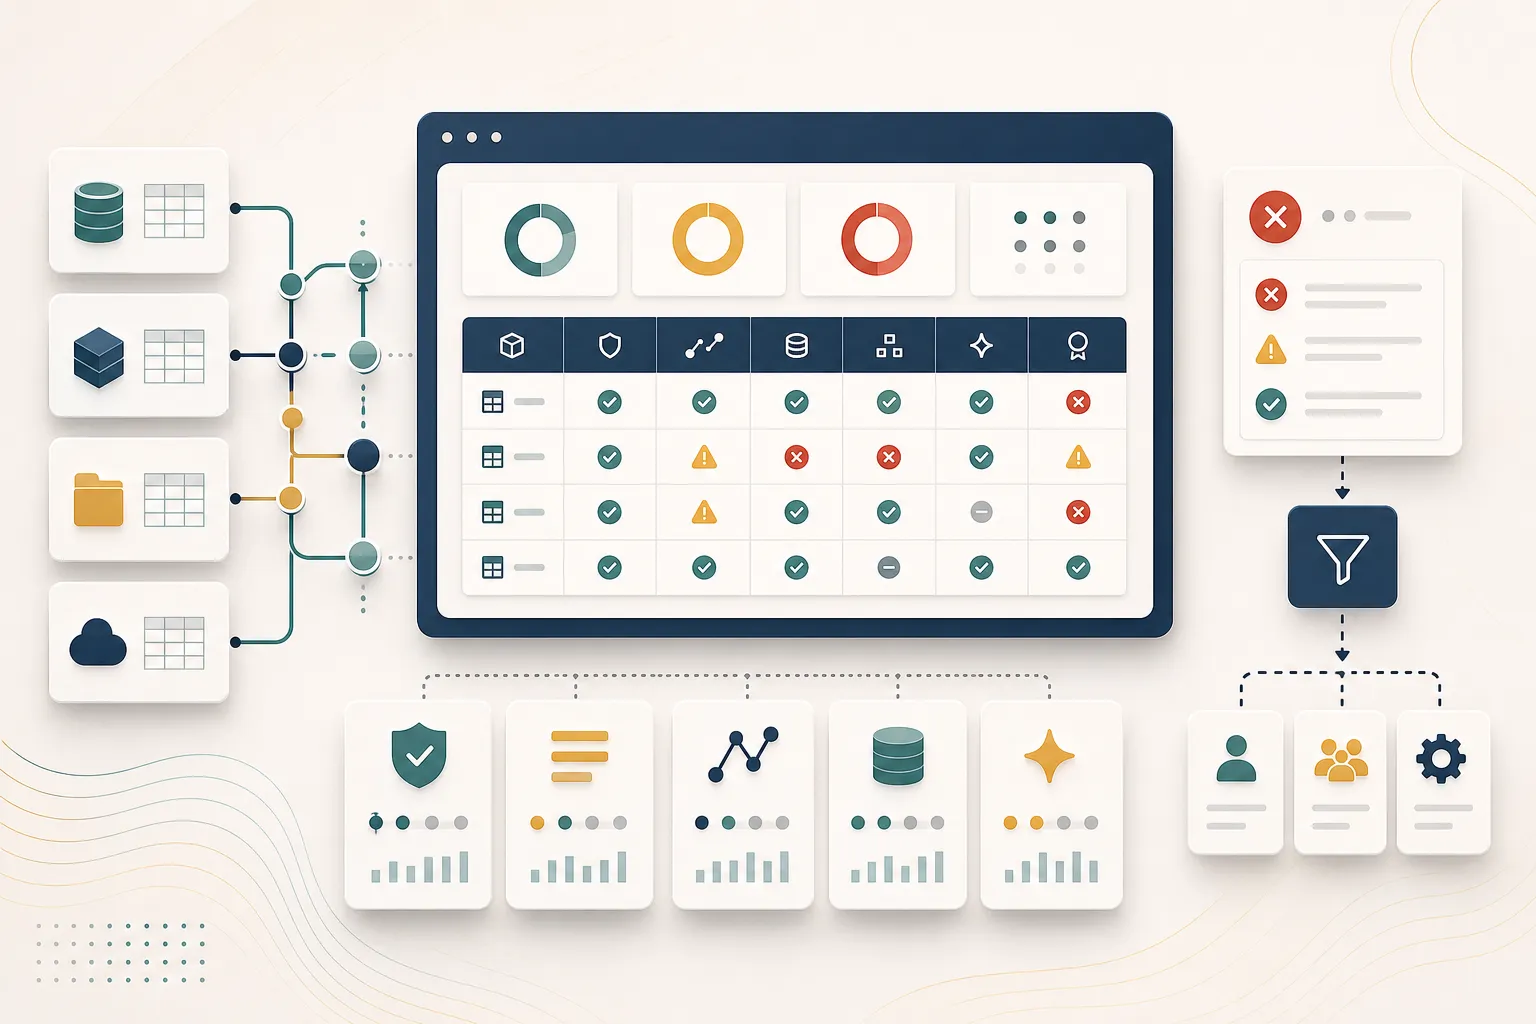
The interim scorecard was delivered on schedule, approved by stakeholders, refreshed automatically each month, and handed over with documentation so the client team could maintain it until the longer-term governance platform was in place.
Governance stakeholders needed an interim way to monitor data quality across critical digital-banking and card platforms before a permanent governance tool was ready.
The work sat inside a governance program where the reporting layer had to bridge a temporary gap before a permanent tool rollout.
Designed and delivered a Power BI data quality scorecard with Azure Databricks-based monthly refresh support, working with governance stakeholders and IT teams to surface completeness, accuracy, and timeliness in one governed view.
The interim scorecard was delivered on schedule, approved by stakeholders, refreshed automatically each month, and handed over with documentation so the client team could maintain it until the longer-term governance platform was in place.
Shows BI delivery tied to governance trust, secure-environment constraints, and a maintainable handover path.
Power BI scorecard design, delivery, and Databricks refresh coordination
Tools: Power BI, DAX, Azure Databricks
Start with the current constraint, what needs to change, and where delivery risk is showing up now.