Iteration signal
15+ Power BI Service updates
Refined through repeated stakeholder review cycles rather than a single design pass.

Outcome-first metrics
Iteration signal
15+ Power BI Service updates
Refined through repeated stakeholder review cycles rather than a single design pass.
Outcome signal
Cross-sell filtering in seconds
The workflow replaced much slower manual analysis for identifying lead opportunities.
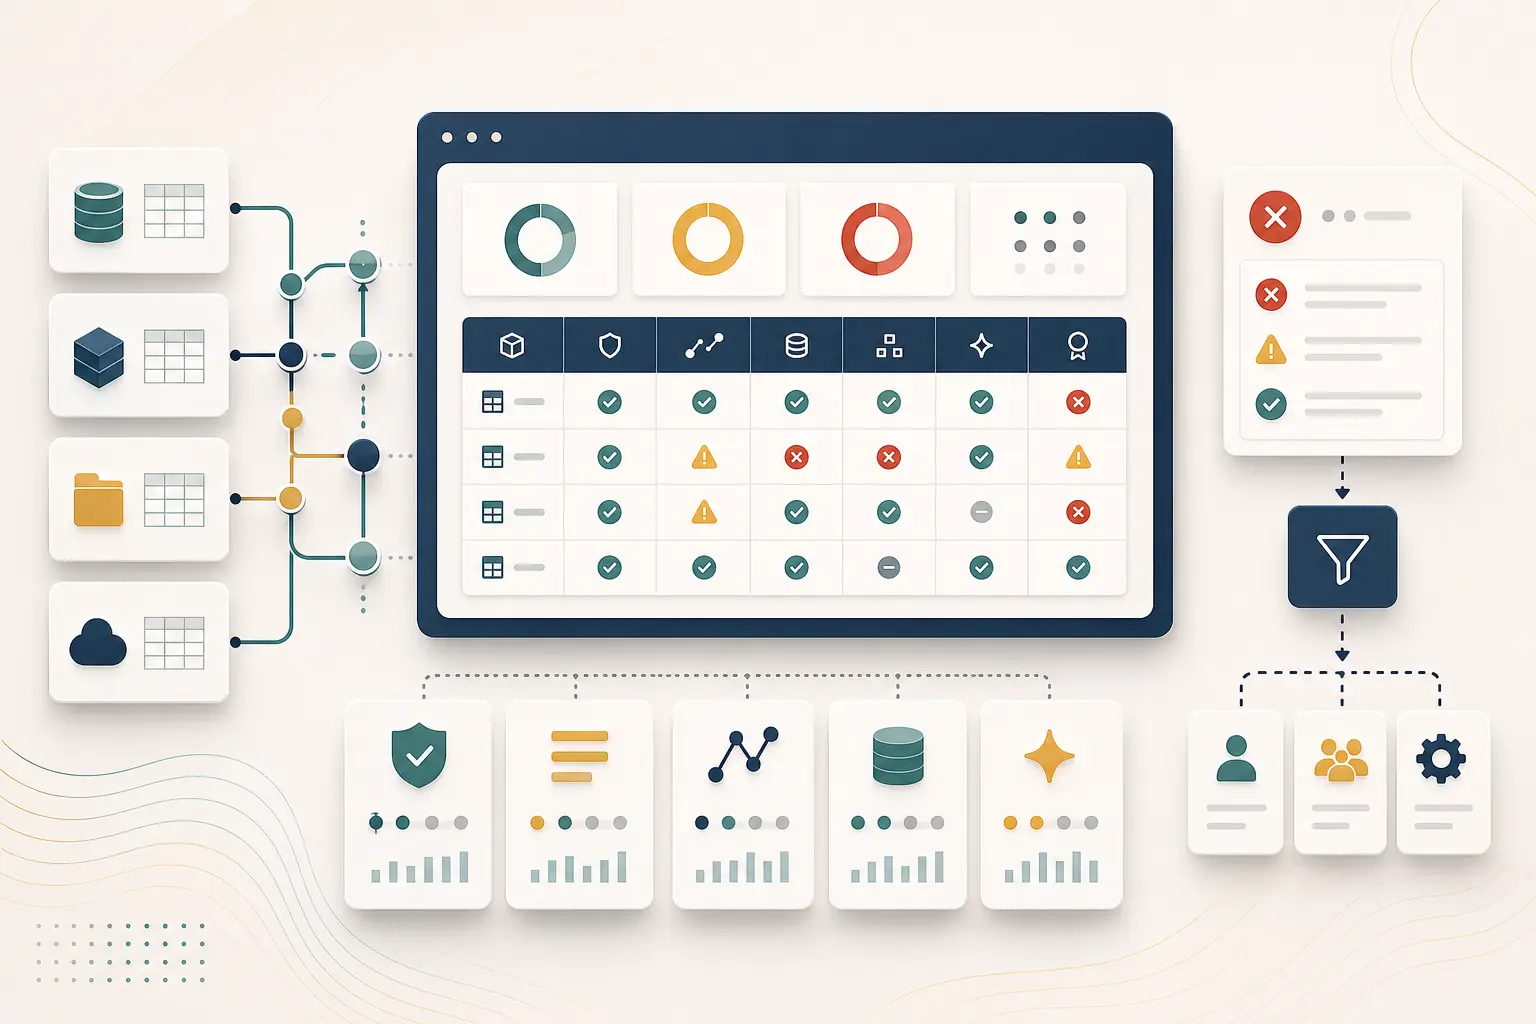
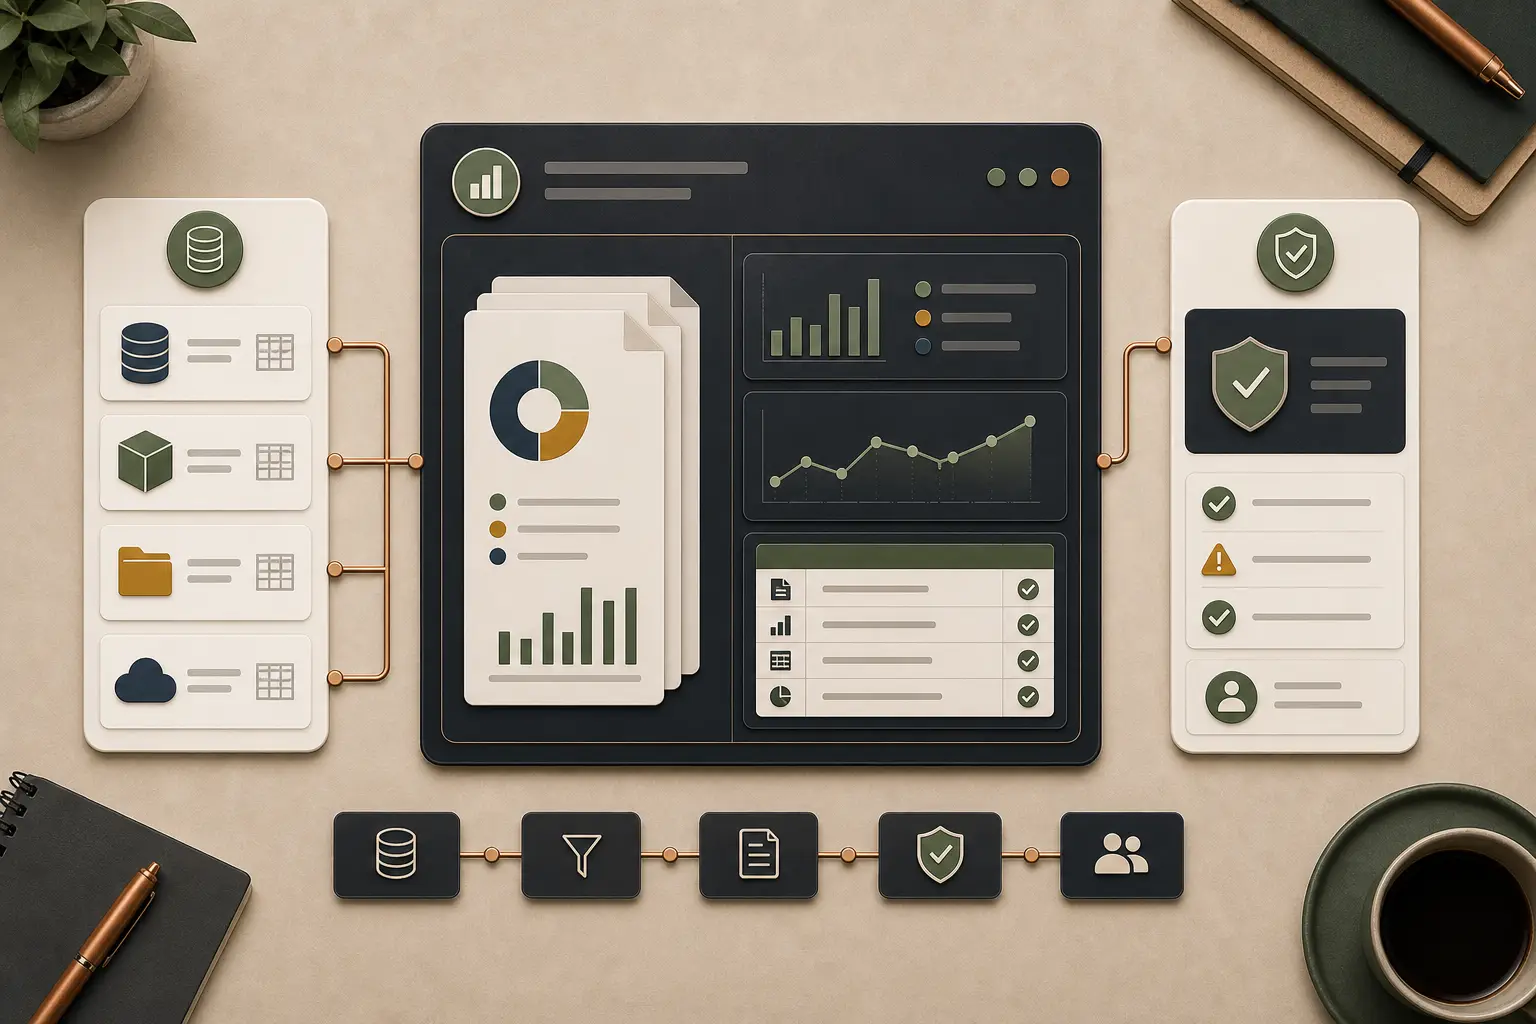
Primary scope
Customer + product + insurance view
Combined multiple business signals in one drillable dashboard.
Summary
The project produced a business-facing dashboard that combined customer and product signals into a single drillable view, enabling faster lead identification and supporting executive walkthroughs and user training.
Problem
Business teams needed a more unified view of customer, product, and insurance data for cross-sell and lead-generation analysis.
Context / Constraints
The dashboard sat inside a broader customer analytics program and had to work for both business users and technical reviewers.
Approach
Led dashboard design and build for a Customer 360 cross-sell workflow, turning requirements into wireframes, prototypes, and a Power BI dashboard with interactive filters, drill-downs, and repeated service-based iterations.
Outcome
The project produced a business-facing dashboard that combined customer and product signals into a single drillable view, enabling faster lead identification and supporting executive walkthroughs and user training.
My Role
Dashboard design, prototyping, and stakeholder walkthroughs
Trade-offs / Lessons
Additional Notes
Contact
Start with the current constraint, what needs to change, and where delivery risk is showing up now.
Related Work
Case studies connected by shared themes, delivery patterns, or adjacent technical focus.
Governance Visibility
Governance stakeholders needed an interim way to monitor data quality across critical digital-banking and card platforms before a permanent governance tool was ready.
What this proves
Shows BI delivery tied to governance trust, secure-environment constraints, and a maintainable handover path.
Reporting Modernization
A new CTRM platform needed specialist Power BI reporting for middle-office, compliance, finance, and trading users, with reliable data flows and near-real-time visibility across multiple report types.
What this proves
Shows specialist reporting delivery in a complex multi-party environment, including data-validation discipline and stakeholder sign-off rather than architecture discussion alone.